Graphing Zabbix Items with Grafana on CentOS 7
Grafana is a beautiful, open source tool that can be used to create dashboards filled with data that has been gathered by a multitude of sources. For this demo, we'll graph some of the data that our Zabbix instance has collected.
Installation of Grafana
- First, we'll need to add the Grafana repo:
[grafana] name=grafana baseurl=https://packagecloud.io/grafana/stable/el/7/$basearch repo_gpgcheck=1 enabled=1 gpgcheck=1 gpgkey=https://packagecloud.io/gpg.key https://grafanarel.s3.amazonaws.com/RPM-GPG-KEY-grafana sslverify=1 sslcacert=/etc/pki/tls/certs/ca-bundle.crt - Just like any other package, we can now go ahead and install Grafana:
yum install grafana -y - Let's enable Grafana on boot and start it now:
systemctl enable grafana-server
systemctl start grafana-server
Adding Zabbix as a Source
- First, we'll need to install the Zabbix datastore plugin:
grafana-cli plugins install alexanderzobnin-zabbix-app - We'll restart Grafana after the plugin's installation has been completed:
systemctl restart grafana-server - Login to your Grafana instance's web UI and hover over the gear button (left side, titled: Configuration).
- When the menu appears, click on Data Sources.
- Click on the Zabbix logo.
- A new page should appear that requires information such as the URL of your Zabbix instance and credentials. Here's what should be entered:
- HTTP > URL: http://127.0.0.1/api_jsonrpc.php
- Auth > With Credentials: Checked
- Auth > Skip TLS Verification (Insecure): Checked (optional)
- Zabbix API details > Username: Username of a service account that has access to all hosts
- Zabbix API details > Password: Password of the service account used above.
- Lastly, click Save & Test.
Graphing Zabbix Items
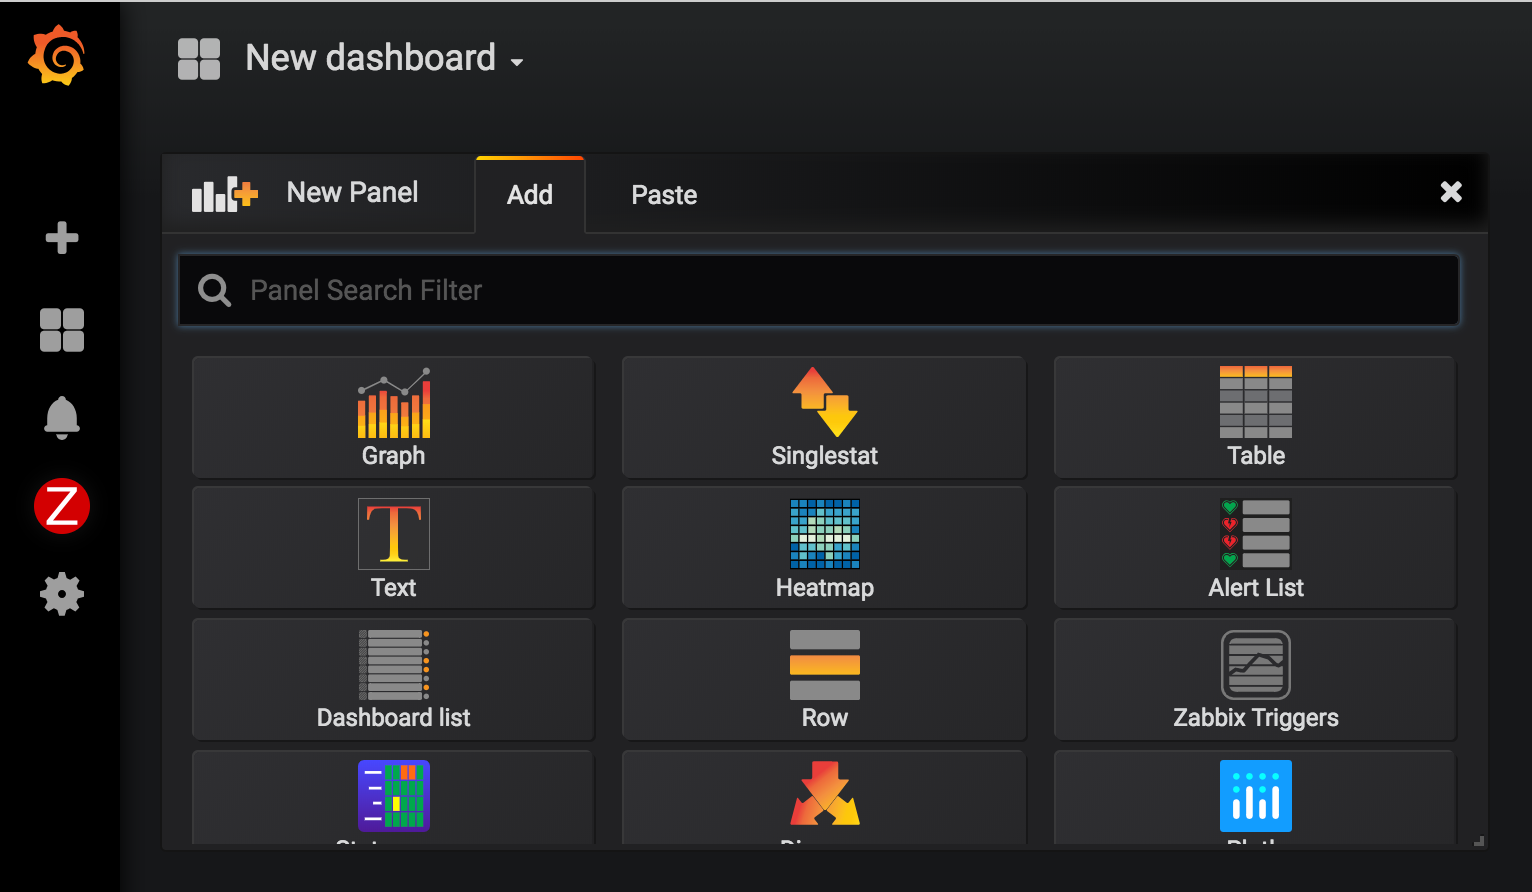
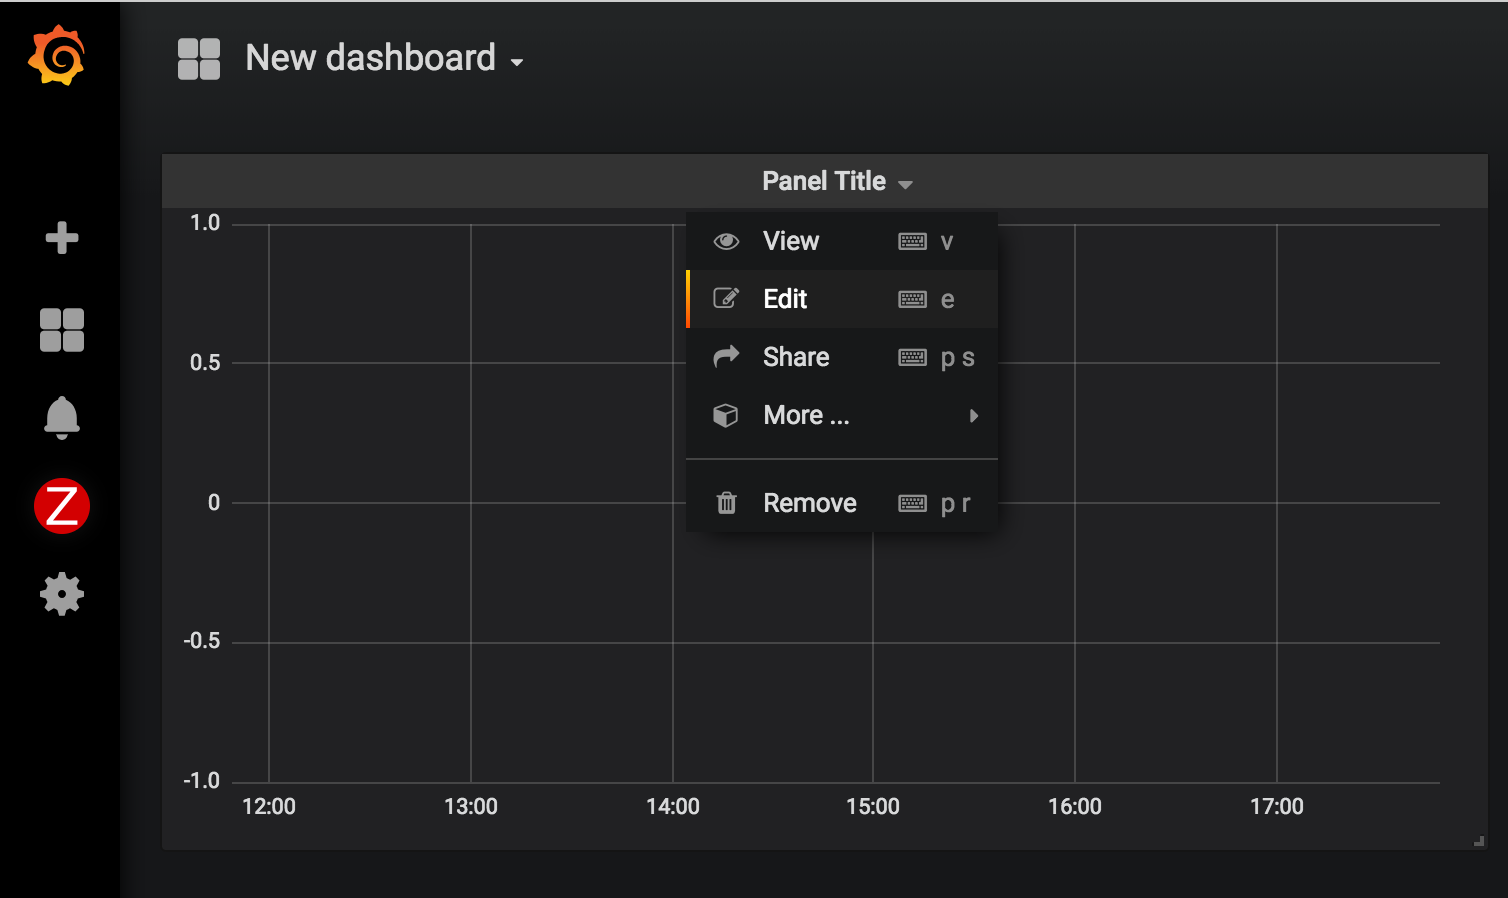
- Now that we have Zabbix added as a datasource, let's create a new dashboard and add our first panel: Graph.
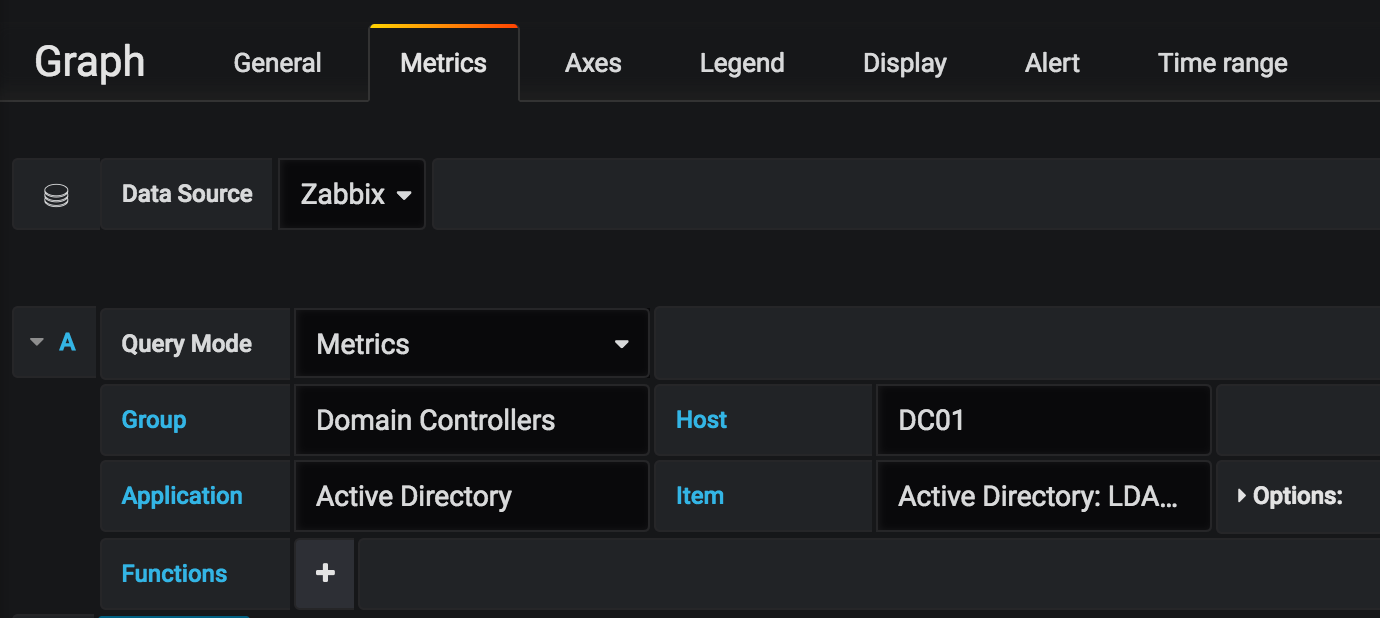
- The new page will automatically bring you to the Metrics tab. Select Zabbix as the data source and then pick a host and item to graph.
- Click the return button (top right, blue) to return to your newly created dashboard.
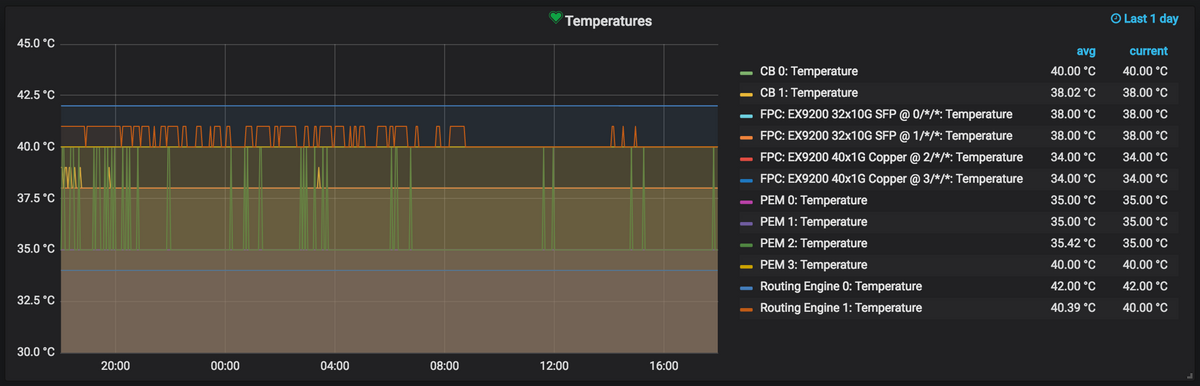
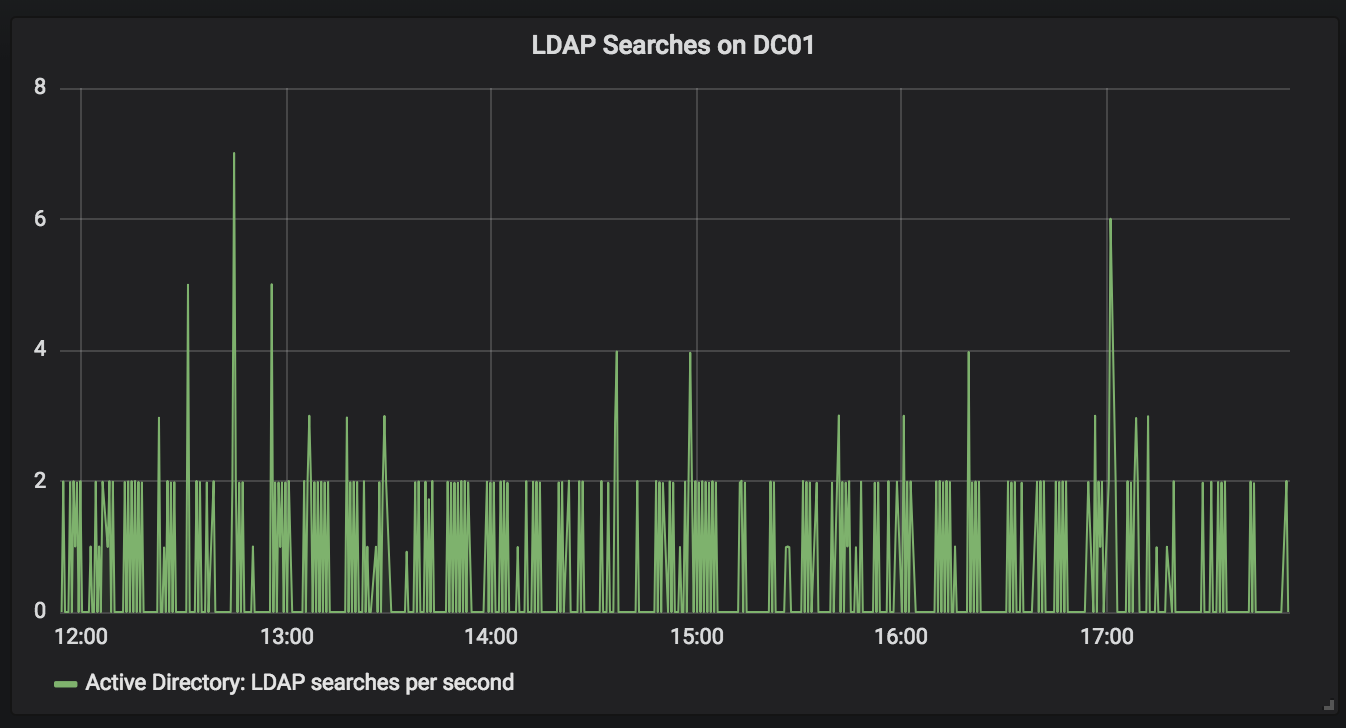
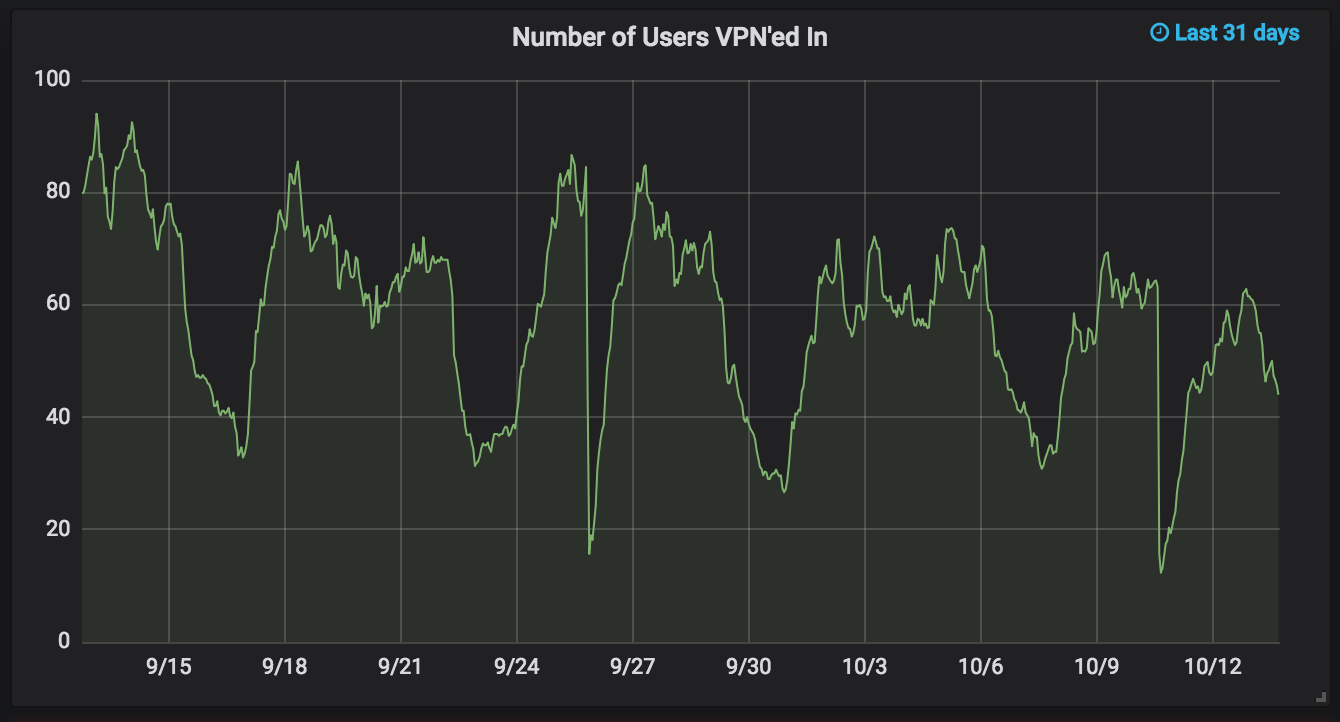
You should now have a beautiful, autogenerated graph of whatever Zabbix item you picked. Grafana graphs are great for graphing items like CPU utilization or number of active VPN users, etc.

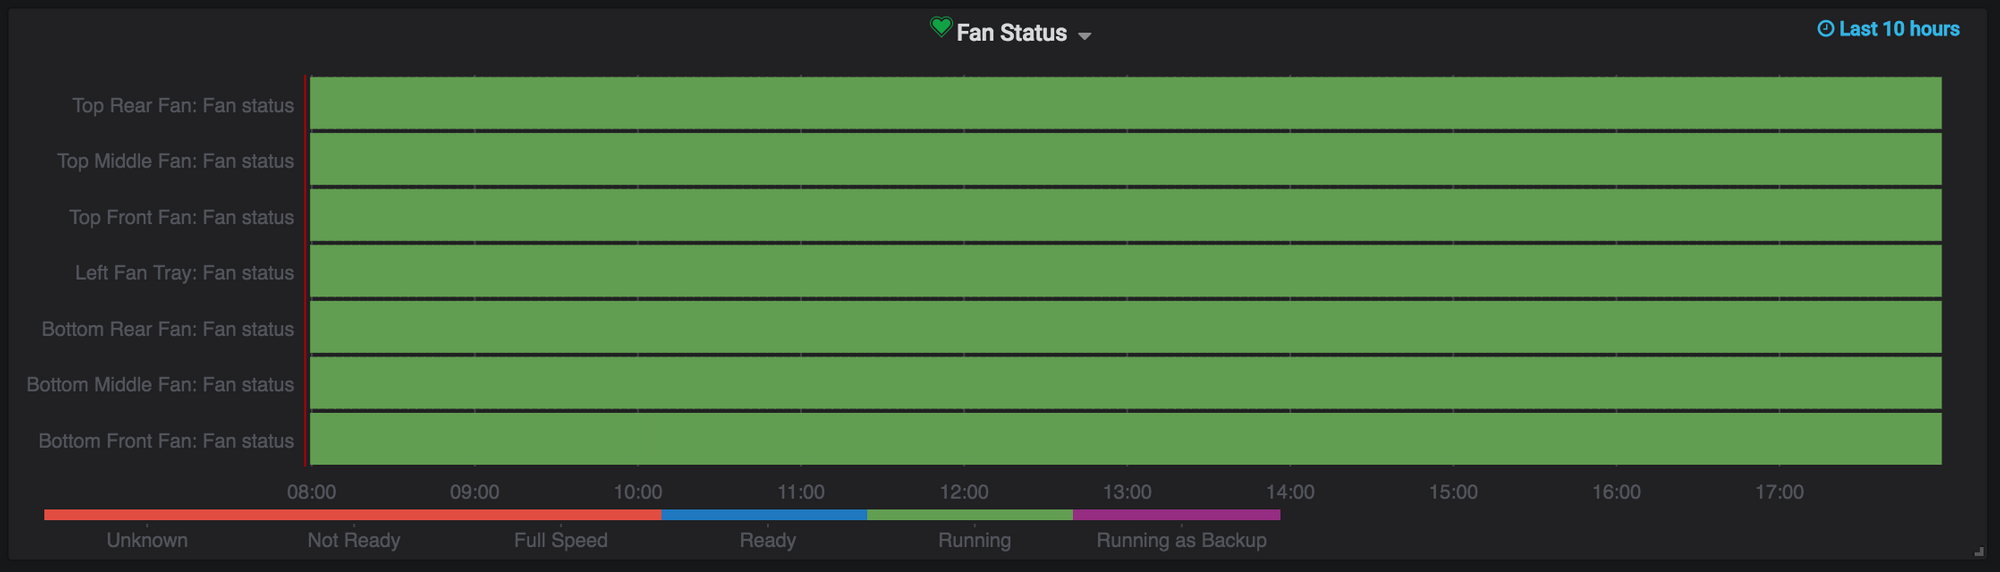
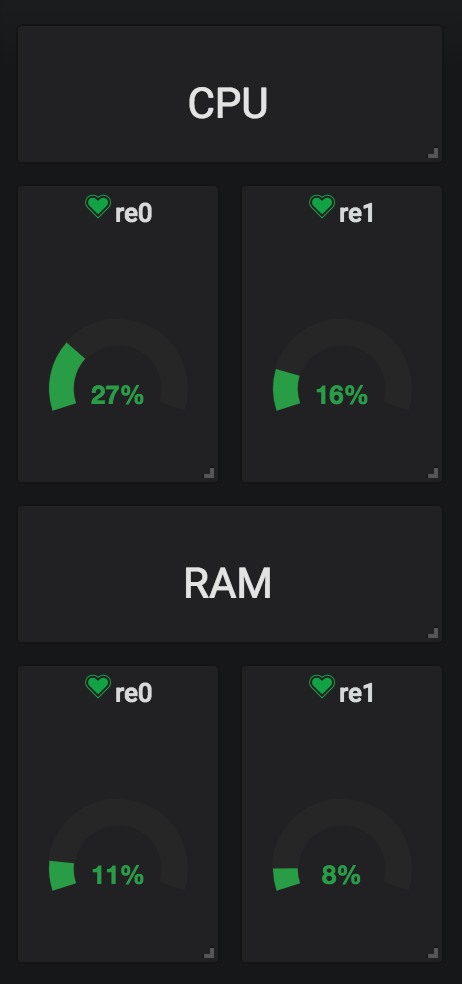
Also, keep in mind that there are multiple panels included (other than Graph) and that there are more available to download.
The possibilities of data representation with Grafana and Zabbix are endless!